{ bias }

  • CS grades: probably more normal than you think they are

    |

    It’s commonly said that computer science grades are bimodal. And people in the CS education community have spent a lot of time speculating and exploring why that could be. A few years back, I sat through a special session at ICER on that very topic, and it occurred to me: has anybody actually tested if the grades are bimodal?

    From what I’ve seen, people (myself included) will take a quick visual look at their grade distributions, and then if they see two peaks, they say it’s bimodal. I’ve done it.

    Here’s the thing: eyeballing a distribution is unreliable. If you gave me some graphs of real-world data, I wouldn’t be able to tell on a quick glance whether they’re, say, Gaussian or Poissonian. And if I expected it to be one of the two, confirmation bias and System 1 Thinking would probably result in me concluding that it looks like my expectation.

    Two peaks on real world data don’t necessarily mean you have a bimodal distribution, particularly when the two peaks are close together. A bimodal distribution means you have two different normal distributions added together (because you’re sampling two different populations at the same time).

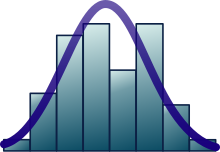
    It’s quite common for normal distributions to have two “peaks”, due to noise in the data. Or the way the data was binned. Indeed, the Wikipedia article on Normal distribution has this histogram of real world data that is considered normal – but has two peaks:

    And since this graph looks in all honesty like a lot of the grades distributions I’ve seen, I decided I’d statistically test whether CS grades distributions are normal vs. bimodal. I got my hands on the final grades distributions of all the undergraduate CS classes at the University of British Columbia (UBC), from 1996 to 2013. That came out to 778 different lecture sections, containing a total of 30,214 final grades (average class size: 75).

    How do you test for normality vs bimodality?

    There are a bunch of ways to test whether some data are consistent with a particular statistical distribution.

    One way is to fit your data to whatever formula describes that distribution. You can then eyeball whether your resulting curve matches the data, or you could look at the residuals, or even do a goodness of fit test. (It’s worth noting that you could fit a normal distribution as bimodal – the two sub-distributions would be extremely close together! If you can fit a normal distribution to it, this is a simpler explanation of the data – Occam’s razor and all.)

    Another way is to use a pre-established statistical test which will allow you to reject/accept a null hypothesis about the nature of your data. I went this route, for the ease of checking hundreds of different distributions and comparing them.

    There are a large variety of tests for whether a distribution is normal. I chose Shapiro-Wilk, since it has the highest statistical power.

    There aren’t as many tests for whether a distribution is bimodal. Most of them work more or less by trying to capture the difference in means in the two distributions that are in the bimodal model, and testing whether the means are sufficiently separate. I used Hartigan’s Dip Test, because it was the only one that I could get working in R #OverlyHonestMethods.

    I also computed the kurtosis for every distribution, because I had read that a necessary but not sufficient condition for bimodality is that kurtosis < 3. When you do thousands of statistical tests, you’re gonna have a lot of false positives. To minimize false positives, I only used Hartigan’s Dip Test on distributions where the kurtosis was less than 3. I set my alpha value at 0.05, so I expect a false positive rate of 5%.

    Test results

    Starting with kurtosis: 323 of the 778 lecture sections had a kurtosis less than 3. This means that 455 (58%) of the classes were definitely not bimodal, and that at most 323 (42%) classes could be bimodal.

    Next I applied Hartigan’s Dip Test to the 323 classes which had a kurtosis less than 3. For this test, the null hypothesis is that the population is unimodal. As a result, if _p_ is less than alpha, then we have a multimodal distribution. This was the case for 45 classes (10% of those tested, 5.8% of all the classes).

    For the Shapiro-Wilk test, the null-hypothesis is that the population is normally-distributed. So, if the _p_ value is less than the alpha value, we can say the population is not normally distributed. This was the case for 106 classes.

    44 of the 45 classes which were previously determined to be multimodal were amongst the 106 classes which the Shapiro-Wilk test indicated weren’t normally-distributed. In short, 13.6% of the classes weren’t normal, many of which are known to be multimodal.

    For the 86.4% of classes where we failed to reject the null hypothesis, we can expect but not guarantee due to type II error that they are normal. I’ve got a large sample size, and good statistical power. From bootstrapping a likely beta value, I estimate my false negative rate is around 1.48%.

    Bottom line: An estimated 85.1% of the final grades in UBC’s undergrad CS classes are normally-distributed. 5.8% of the classes tested as being bimodal, which isn’t a whole lot more than the false positive rate I’d expect to see (5%).

    Discussion

    I’ve only analyzed distributions from one institution, so you might be thinking “maybe UBC is special”. And maybe UBC_ is _special.

    I couldn’t get my hands on a similar quantity of data from my home institution (U of Toronto). But every U of T class I could test was normally-distributed (n=5). Including classes that I’d taught, where I’d eyeballed the grades, and then told my colleagues/TAs/students that my grades were bimodal. Oops.

    Since I thought CS classes were bimodal, when I looked at my noisy grades distributions, I saw bimodality. Good old System 1 Thinking. Had I taken the time to fit my data, or statistically test it, I would have instead concluded it was normally-distributed.

    I’m currently reading Stephen Jay Gould’s The Mismeasure of Man, and this part stuck out for me: “Statisticians are trained to be suspicious of distributions with multiple modes.” Where you see multiple modes, you’re likely either looking at a lot of noise – or two populations are improperly being sampled together.

    Why are CS distributions so noisy? My colleague Nick Falkner recently did a series of blog posts on assessments in CS classes, and how they’re so truly ugly. And my colleagues Daniel Zingaro, Andrew Petersen and Michelle Craig have written a couple of lovely articles which together paint a story that if you ask students a bunch of incremental small concept questions, rather than one giant all-encompassing code-writing question, you get grades distributions which look more normal. How we assess our students affects what sort of distribution we get.

    Perhaps once we as CS educators figure out better ways to assess our students, our grades distributions won’t be quite so noisy – and prone to miscategorization?

  • Impostor syndrome viewed through the lens of social theory

    |

    Sociologists like to use performance as a metaphor for everyday life. Erving Goffman in particular championed the metaphor, bringing to light how our social interactions take place on various stages according to various scripts. And when people don’t follow the right script on the right stage, social punishment ensues (e.g. stigma).

    Pierre Bourdieu rather similarly described social interactions as taking place in arenas, seeing them more like games than plays. (Sometimes champs is translated as ‘field’ rather than arena; it’s worth noting Bourdieu intended for it to have a connation of sport/war.) Rather than a script, people get a sense for the rules of the game. And when people don’t follow the rules of the game, social punishment ensues.

    Whether one is failing at a social game or performance, social punishment can take many forms. For example, sexual harassment is most reported by those who go against gender roles. Powerful women are more likely to be harassed than less powerful women. Women in male-dominated fields are more likely to be harassed. Men who are effeminate, gay, or champions of feminism, are more likely to be harassed. Harassers act to keep people “in their place”.

    Since not following the script/game is costly for individuals, we’re trained from a young age to be on the lookout for cues about what stage/arena we’re on and what role we should be playing. Looking for and responding to cues is something we do automatically most of the time. Kahneman would see it as an example of System 1 thinking.

    Impostor syndrome is the sense that you’re the wrong person to be playing the role you’re in. You’re acting a role that you’ve been trained in and hired for – but your brain is picking up on cues that signal that you’re not right for the role.

    The Caltech Counselling Centre has this to say on “who is likely to have the impostor syndrome?“:

    Attitudes, beliefs, direct or indirect messages that we received from our parents or from other significant people in our lives early on may have contributed to the development of impostor feelings. Certain family situations and dynamics tend to contribute to impostor feelings: when the success and career aspirations conflicts with the family expectations of the gender, race, religion, or age of the person, families who impose unrealistic standards, families who are very critical, and families who are ridden with conflict and anger.

    Some researchers identify two main types of family dynamics that can contribute to impostor feelings, although there may be others.

    Family Labels:  Different children in a family may be identified or labeled differently.  For example, some families have one “intelligent” child and one “sensitive” child.  While growing up, many times families will not change their perception of each child, no matter what that child does.  Therefore, the sensitive child, even if she gets better grades or more awards may not be recognized for her intelligence.  This can lead to doubting her intelligence and believing the family is correct even with evidence, which contradicts these labels. 
    The sensitive child in this example has been raised to play the script of the sensitive child. When they go on to play other roles, they still sometimes encounter social cues indicating they’re in the wrong role. Impostor syndrome results.

    Impostor syndrome is thought to be quite common amongst women in science. In this light I don’t think it’s surprising: there are so many cues in society that we are not what a ‘scientist’ is supposed to look or act like. We don’t fit the stereotypes. Many female scientists were raised to be that sensitive child.

    I started reading about impostor syndrome when I was asked if I had any ideas on whether Impostor Syndrome is a recent phenomenon in society. The syndrome was first termed in the 70s, but sociologists and psychologists had described similar things well before then.

    I would expect its prevalence is a relatively recent phenomenon. In “the good old days” people had extremely rigid options for what roles they could have in society. Women had few if any career options. There was little social mobility. Non-white people had even less social mobility. Most people followed a career trajectory sculpted by their parents – not by themselves. And so, people had a script determined for them. Relatively few people had the ability to deviate from it successfully. They could only play roles that had been assigned to them.

    In modern society, most of us have the privilege of picking the roles we want to play. Regardless of whether we were raised to fit the role, or look like the stereotype. I don’t think people with impostor syndrome are crazy:_ I think they’re picking up on cues that they’re not in a role they were created to be in_.

    Reflecting on the times I’ve experienced impostor syndrome, they were situations where I didn’t look the part (too young, too female). Or they were situations that I hadn’t been raised to fit into – I was raised to be nerdy/geeky. I feel like an impostor at the gym, and I definitely felt like an impostor when I taught a fencing class many years ago.

    I don’t have a magic answer for getting over impostor syndrome, and the link between social cues and impostor syndrome stands only as a hypothesis at this point. But I do think we impostors are necessary to subvert social scripts. Just because you don’t look the stereotype or were raised to do doesn’t mean you can’t, and hopefully that won’t stop you.

    References:

    Berdahl, J. 2013. Testimony on Sexual Harassment to the Canadian House of Commons Standing Committee on the Status of Women.
    Bourdieu, P. 1979. La distinction.
    Caltech Counselling Center. The Impostor Syndrome.
    Goffman, E. 1959. The Presentation of Self in Everyday Life.
    Kahneman, D. 2011. Thinking Fast and Slow.